Work of Breathing, compliance and resistance

Take home messages
- Learning to draw graphs of respiratory physiology is low-fun but high-yield - take the time to know them as well as you can
- Understanding the underlying physiology can help you out when it comes to management of the clinically tricky respiratory patient - even if you're not drawing graphs while resuscitating the patient...
Podcast Episode
There are lots of graphs in anaesthetics
And a lot of them are on the topic of respiratory physiology, because the lungs are deceptively complex organs and they only exist to make your life harder.
It is commonplace in the SOE and OSCE components of the Primary FRCA exam to be asked to draw and explain a graph that describes a particular aspect of respiratory physiology, which to be frank is fairly brutal - it's not easy stuff at the best of times, let alone under pressure.
But here at Anaestheasier we're committed to making it a little easier...
So let's dive in.
Please draw the work of breathing graph and explain it
This one is a classic, and we recommend explaining as you draw, both to save time in the exam and to remind yourself how the graph is meant to look.
Effort is required to lift and expand the thoracic cage, and to combat the elastic nature of the lung tissue itself, as well as resistance to air flow.
Then quiet expiration uses this stored potential and elastic energy to expel the air from the lungs, and therefore is considered passive in healthy lungs. However if there is obstruction to exhalation and more force is required to overcome this, then expiration is active.
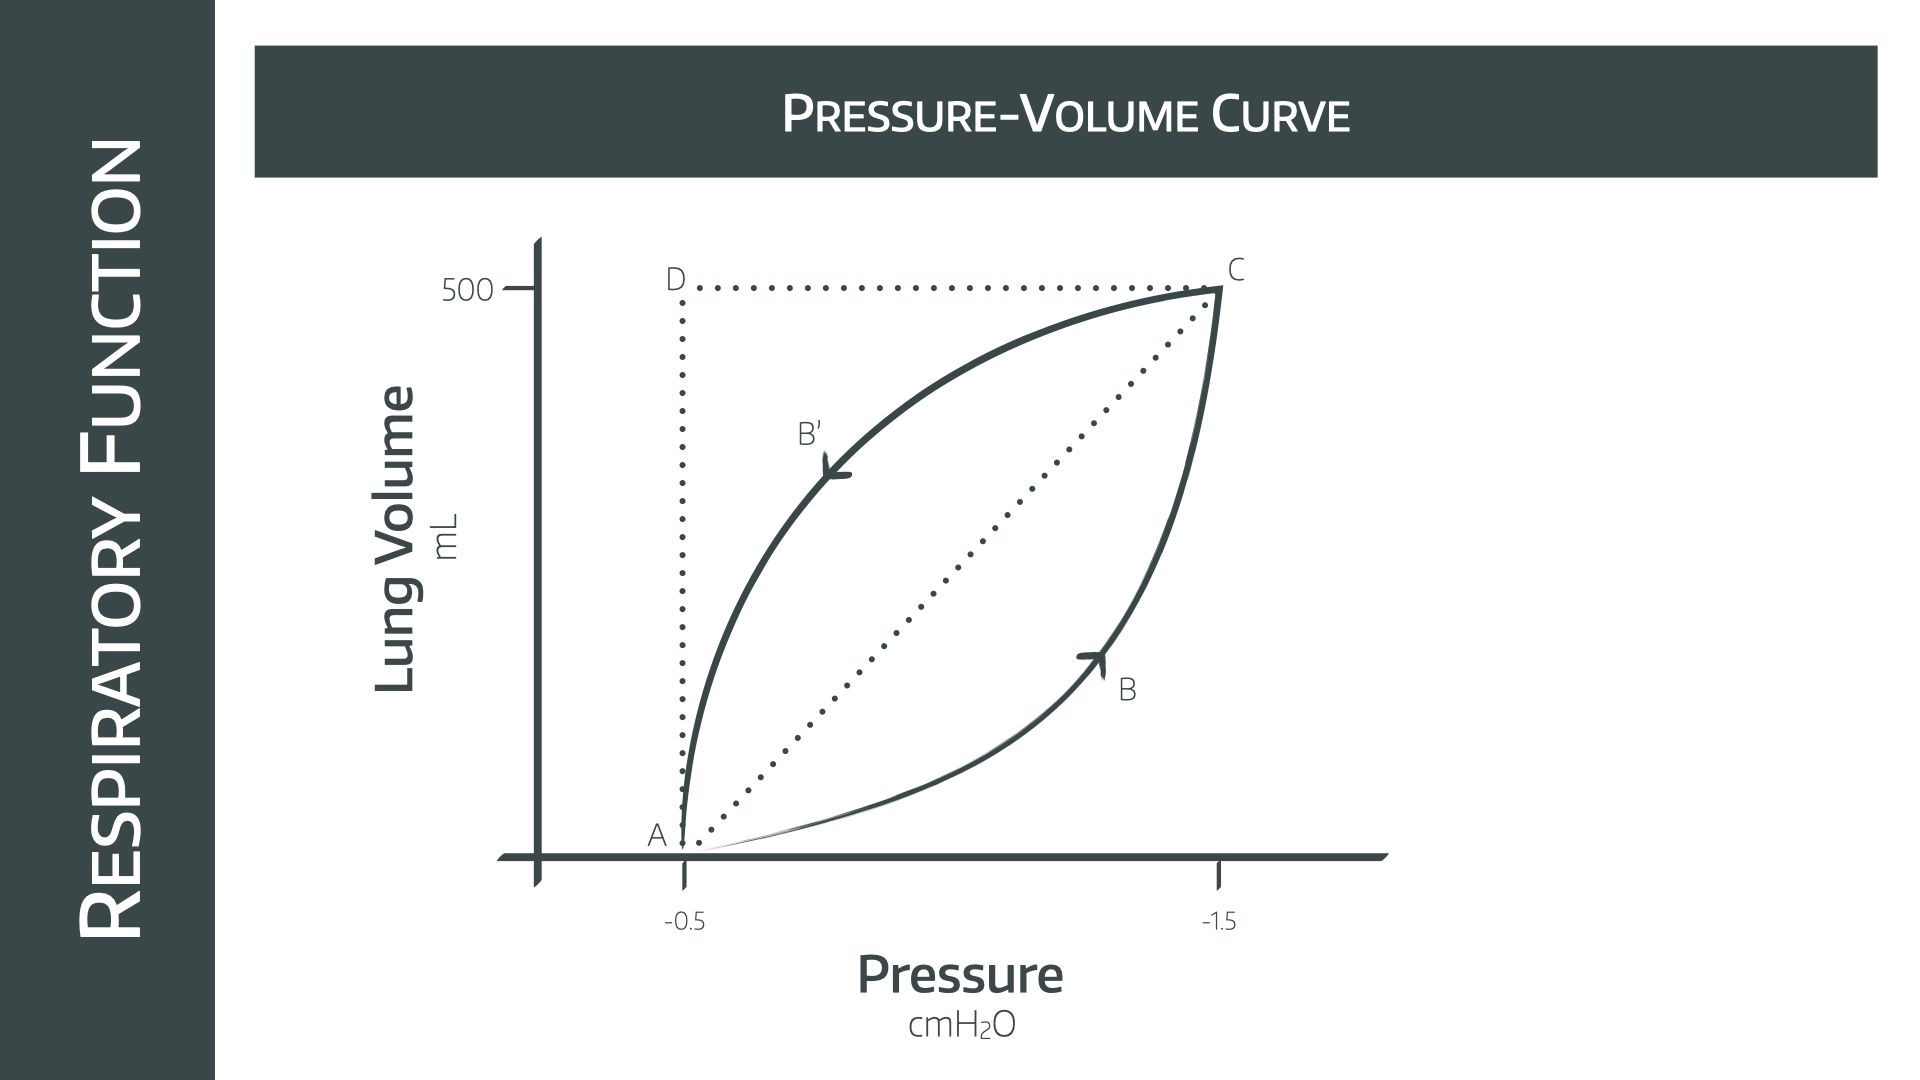
How to describe and draw the graph
- Start on the x axis at -0.5kPa (point A), representing the negative pressure generated by the thoracic wall ‘suspending’ the lungs via the intrapleural space
- Point C then represents full inspiration.
- A perfect system with no resistance to air flow or loss of energy would simply travel in a straight line between A and C
- But in reality the resistance offered by the turbulent air flow means that there is increased work, and more pressure is required to generate the required flow
- Therefore area ABCA is the work required to overcome dynamic airflow resistance
- Area ACDA is the work required to overcome the static elastic resistance of the lung tissue*
- Likewise during expiration the resistance to air flow means that CB’AC is the work done to combat dynamic airway resistance
- Since this is within ACDA, there shouldn’t be any active effort required as this can simply be released from the elastic potential energy of the lung tissue, but if the CB’AC curve crosses the AD line because of increased obstruction, then active work is required to exhale
- ACDA - CB’AC = energy dispersed as heat
*If you're asked to justify why area on this graph represents work, remember that work is force times distance.
Pressure is force over area, and volume is area times length, so when multiplied together the 'area' terms cancel out, leaving behind force times length.
How does CO2 affect ventilation?
CO2 is the main driver of respiratory activity in the medulla. CO2 dissolves readily in the plasma, forming carbonic acid, which then promptly dissociates into hydrogen and bicarbonate ions. This allows CO2 to trigger peripheral chemoreceptors in the blood.
Charged molecules and ions generally have a tough time crossing the blood brain barrier without a specific carrier molecule, however CO2 can diffuse across into the CSF relatively easily.
It then does exactly the same in the CSF, producing hydrogen ions and bicarbonate, however the difference here is there are pretty much zero buffering systems present in the CSF, meaning any tiny change in CO2 levels will cause a rise in H+ ion concentration, and therefore a drop in the CSF pH. This allows CO2 to trigger central chemoreceptors in the medulla, and is also why the CSF is so much more sensitive to pH changes than the blood.
- Peripheral chemoreceptors respond to PCO2 and pH via the carotid bodies (glossopharyngeal) and aortic bodies (vagus nerve)
- Central chemoreceptors respond to pH changes in the CSF and increase minute ventilation
Here's the graph
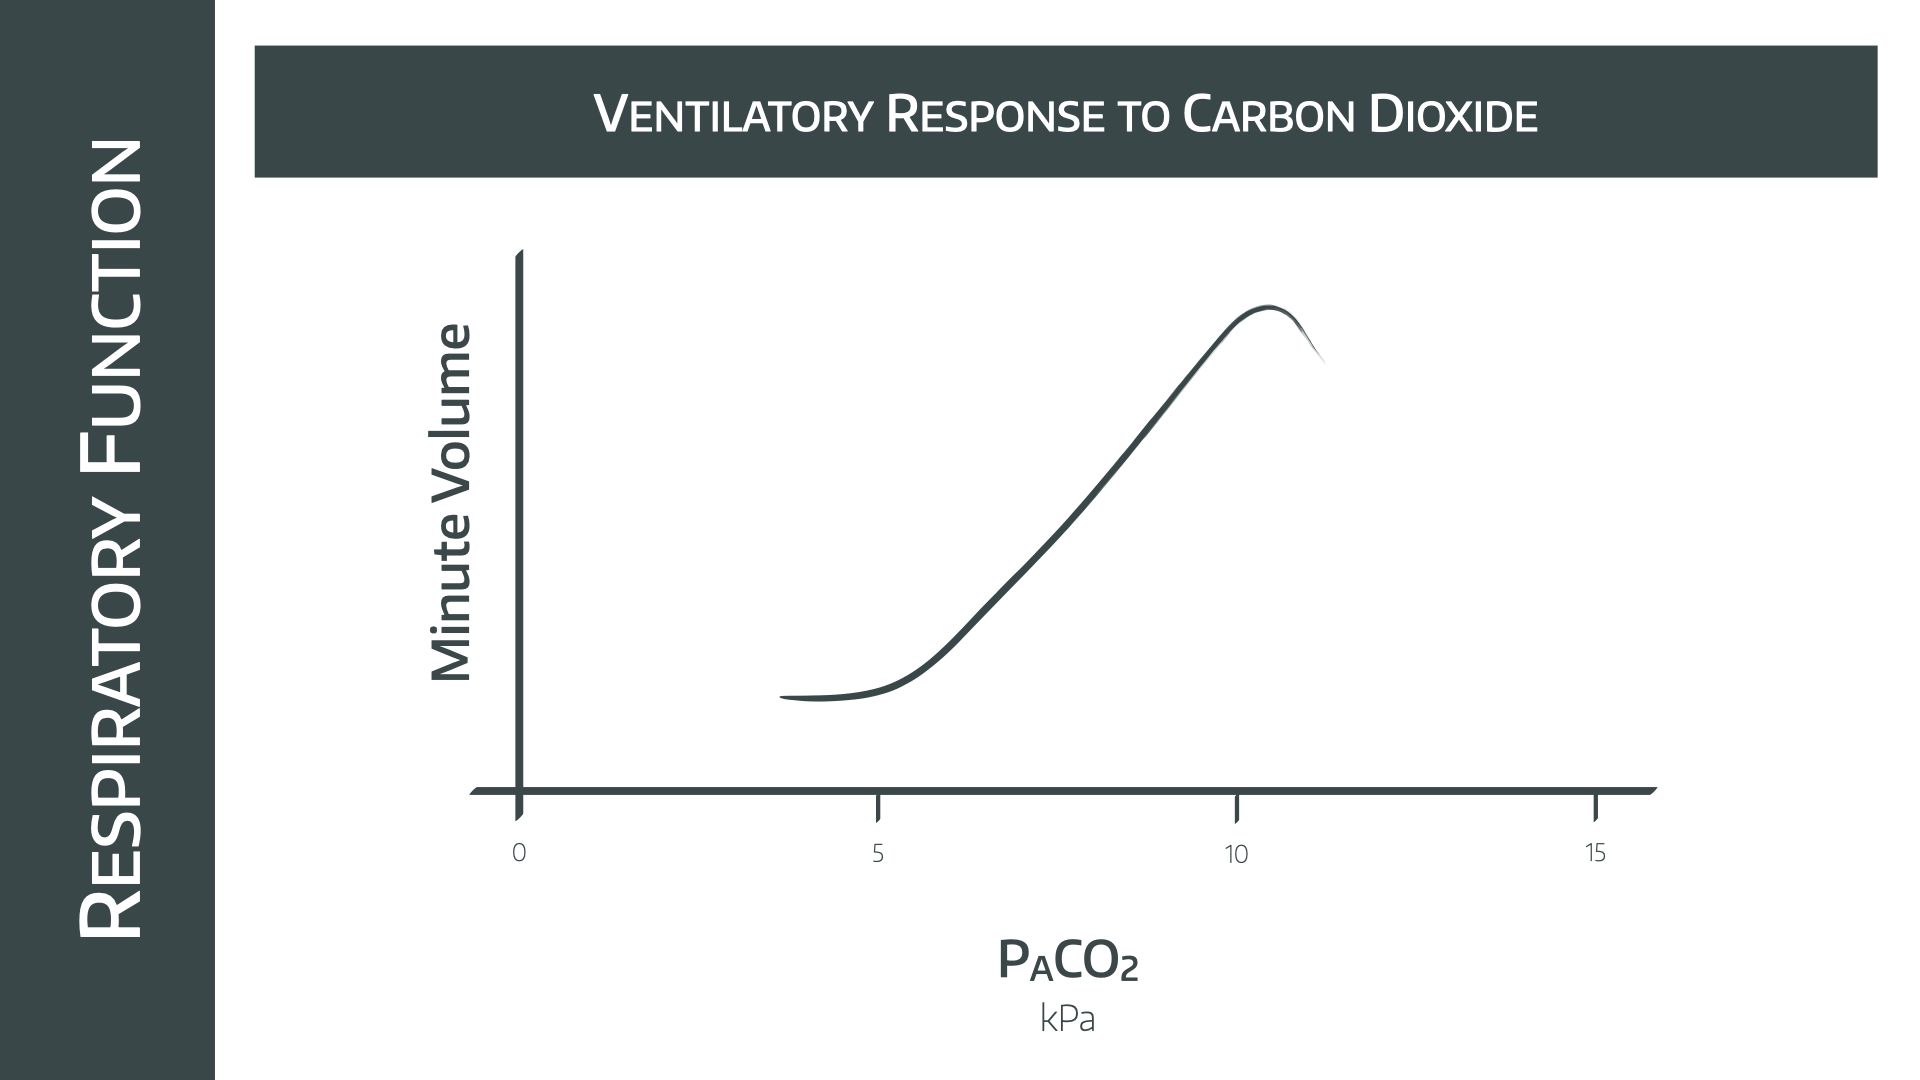
- Note the relatively linear increase in minute ventilation as PACO2 increases between 5 and 10kPa
- Doubling the PACO2 causes minute ventilation to increase by 4x
- Above 10kPa the effects of narcosis are seen, and minute ventilation starts to fall
What effect does chronic CO2 retention have on this graph?
- A raised threshold is seen in chronic CO2 retainers (COPD), which shifts the graph to the right
- This is because chronic exposure to high levels of CO2 essentially changes the 'set point' in the central nervous system, as bicarbonate ions are actively pumped from the blood to the CSF to normalise the pH
- This means a greater level of CO2 is required to achieve the same effect in the medulla
The graph is the same shape and height, just shifted to the right.
What effect do opioids have on this graph?
- Opioids cause reduced CO2 sensitivity, causing a right shift and vertical compression of the graph
Not only is the amount of CO2 needed to generate a response in the medulla higher, the overall response seen is reduced as well.
What effect does acidosis have on this graph?
- At any given point on the graph, the gradient is steeper if there is acidosis present
This is understandable, as the pH will likely trigger the same chemoreceptors that the increased PaCO2 is affecting.
How does ventilation affect CO2?
Note that this question is the other way around, and the graph is completely different.
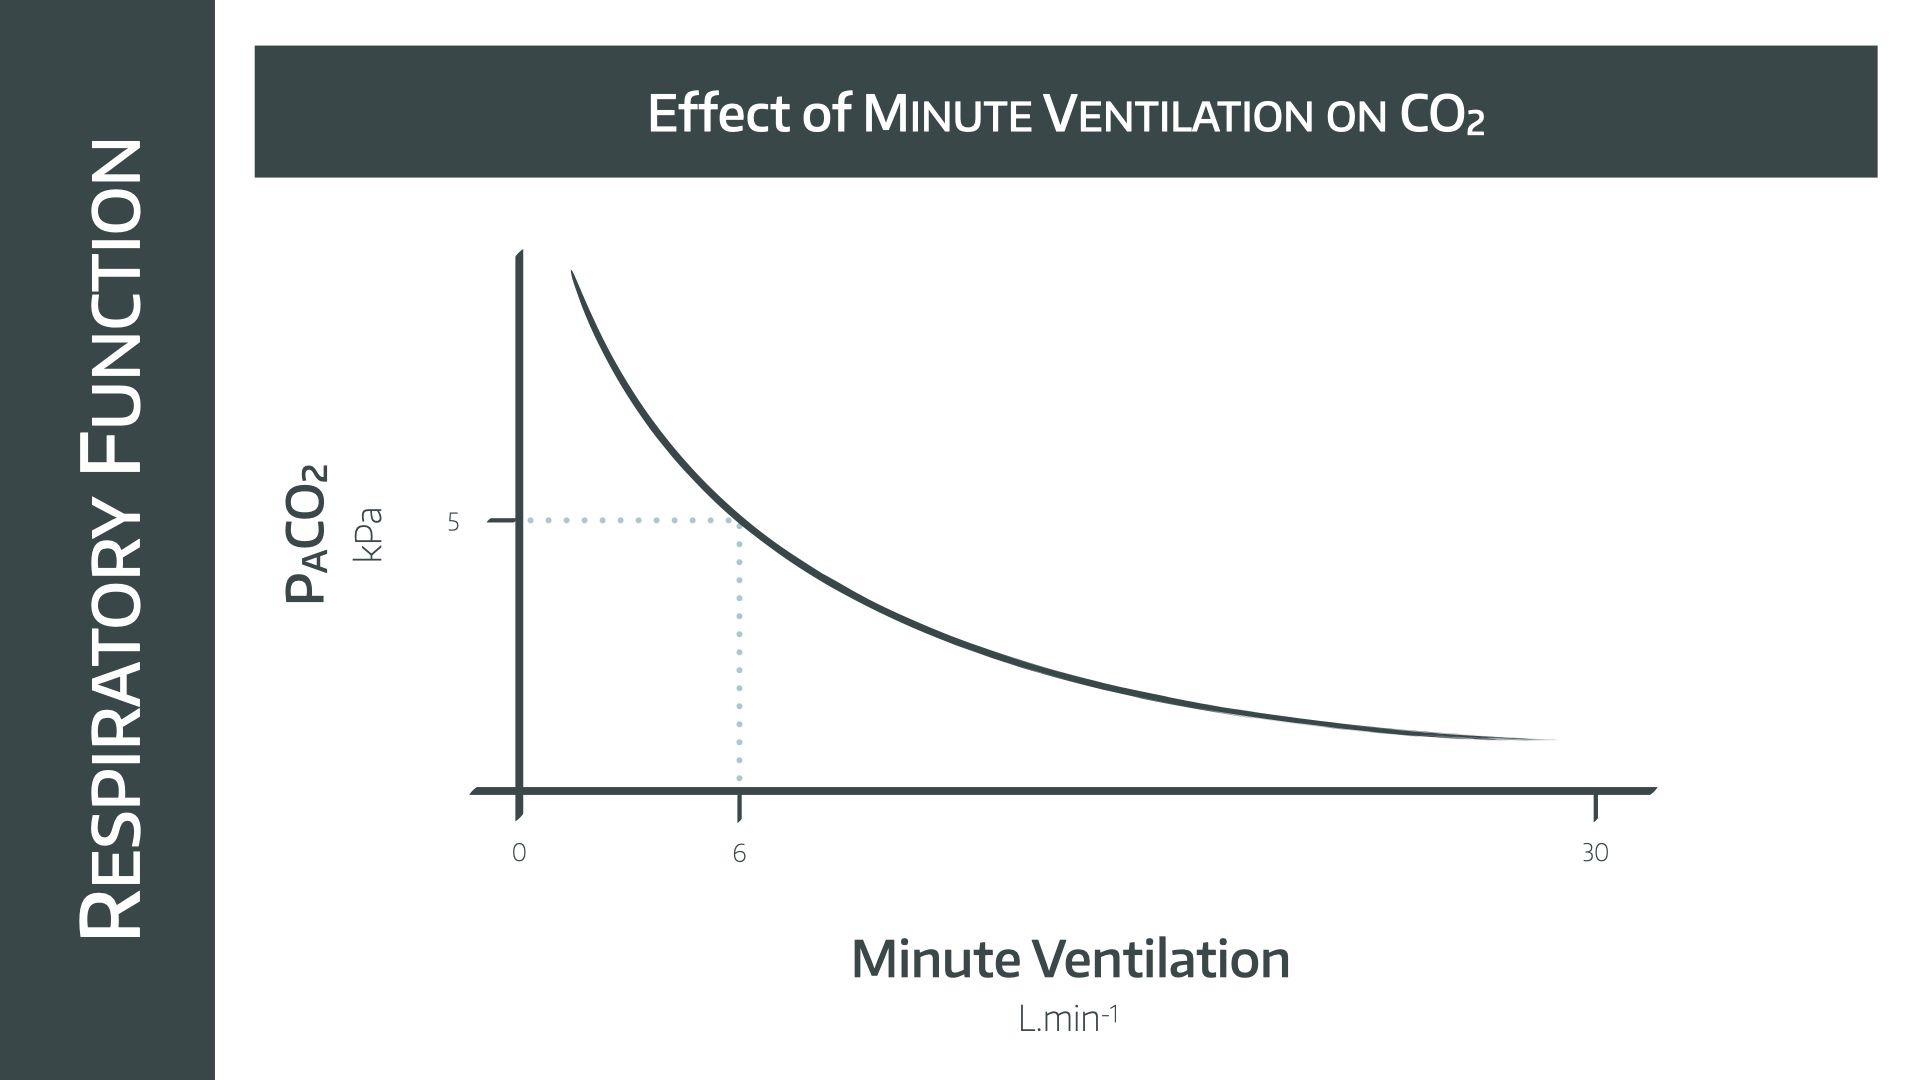
As you increase minute ventilation, the amount of CO2 that is exhaled from the alveoli increases, and since it diffuses so rapidly across from the blood into the alveoli to replace this loss, the partial pressure in the blood plummets as well.
- This is a rectangular hyperbolic graph
- The line passes through a 'normal' CO2 of 5kPa at 6 litres per minute
- As alveolar minute ventilation doubles, PACO2 halves (note this is different to the relationship in the previous graph)
How does PAO2 affect minute ventilation?
Oxygen does play a role in respiratory drive but to a far lesser extent than CO2. Its main impact is seen at very low partial pressures, where hypoxic drive starts to kick in.
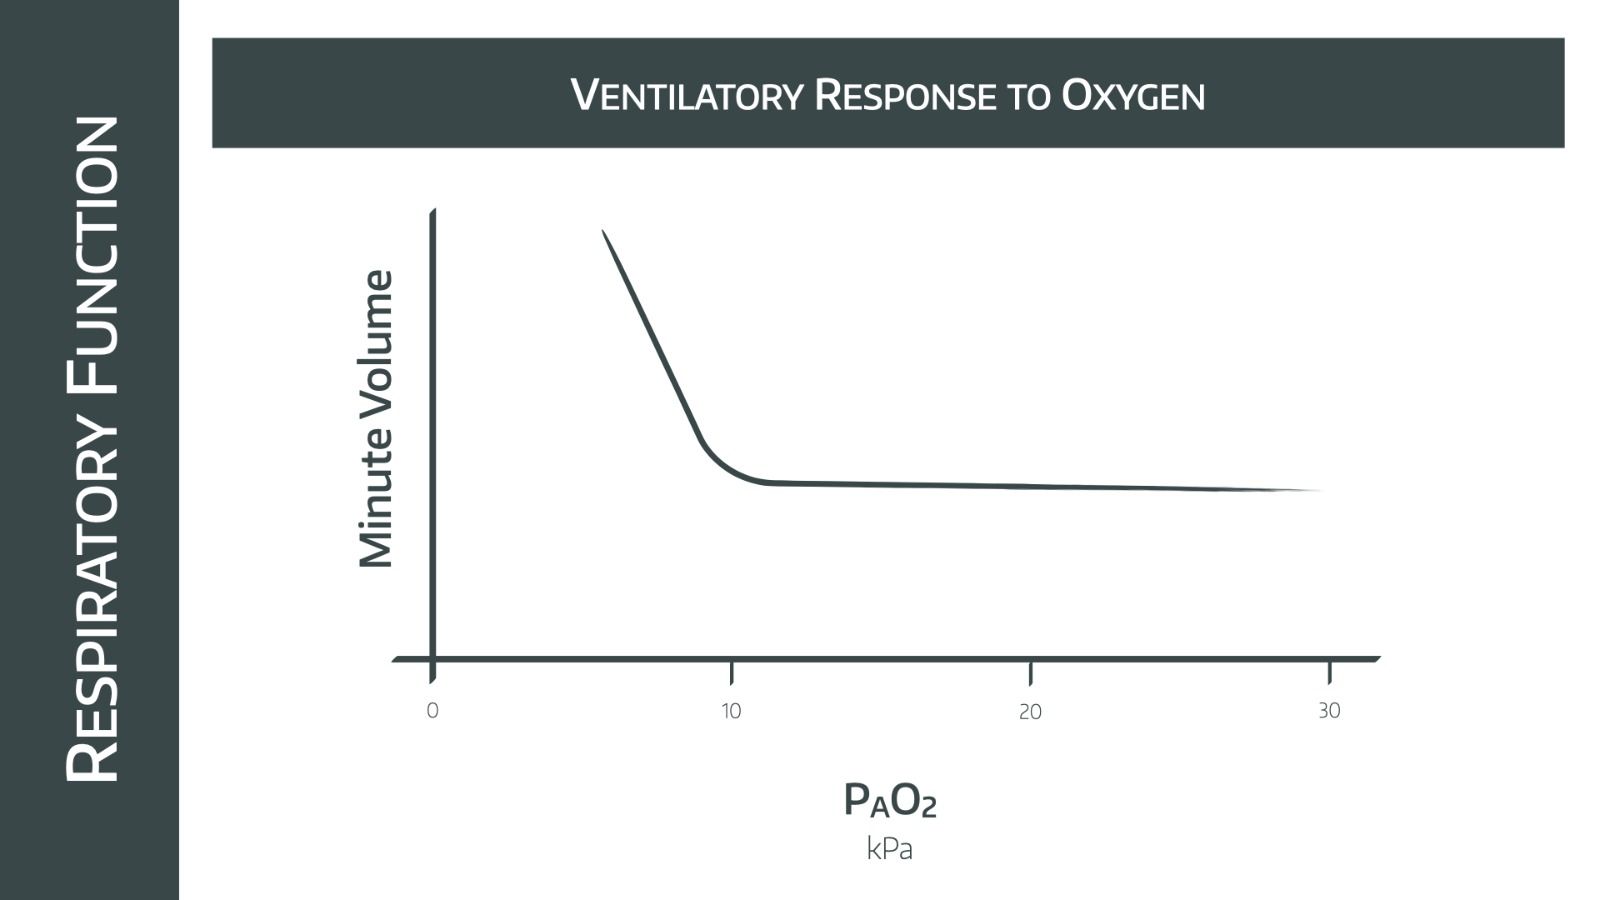
- Generally the minute ventilation doesn’t change dramatically with changes in PAO2, as long as it remains higher than 10kPa
- Below 8kPa minute ventilation increases dramatically as peripheral chemoreceptors trigger the respiratory centre (Hypoxic drive)
Note that if there is also hypercapnoea, then the line moves up and to the right, demonstrating increased minute ventilation caused by central chemoreceptors.
How does minute ventilation affect PAO2?
Again note that the question is the other way round, and make sure you know which one you’re being asked!
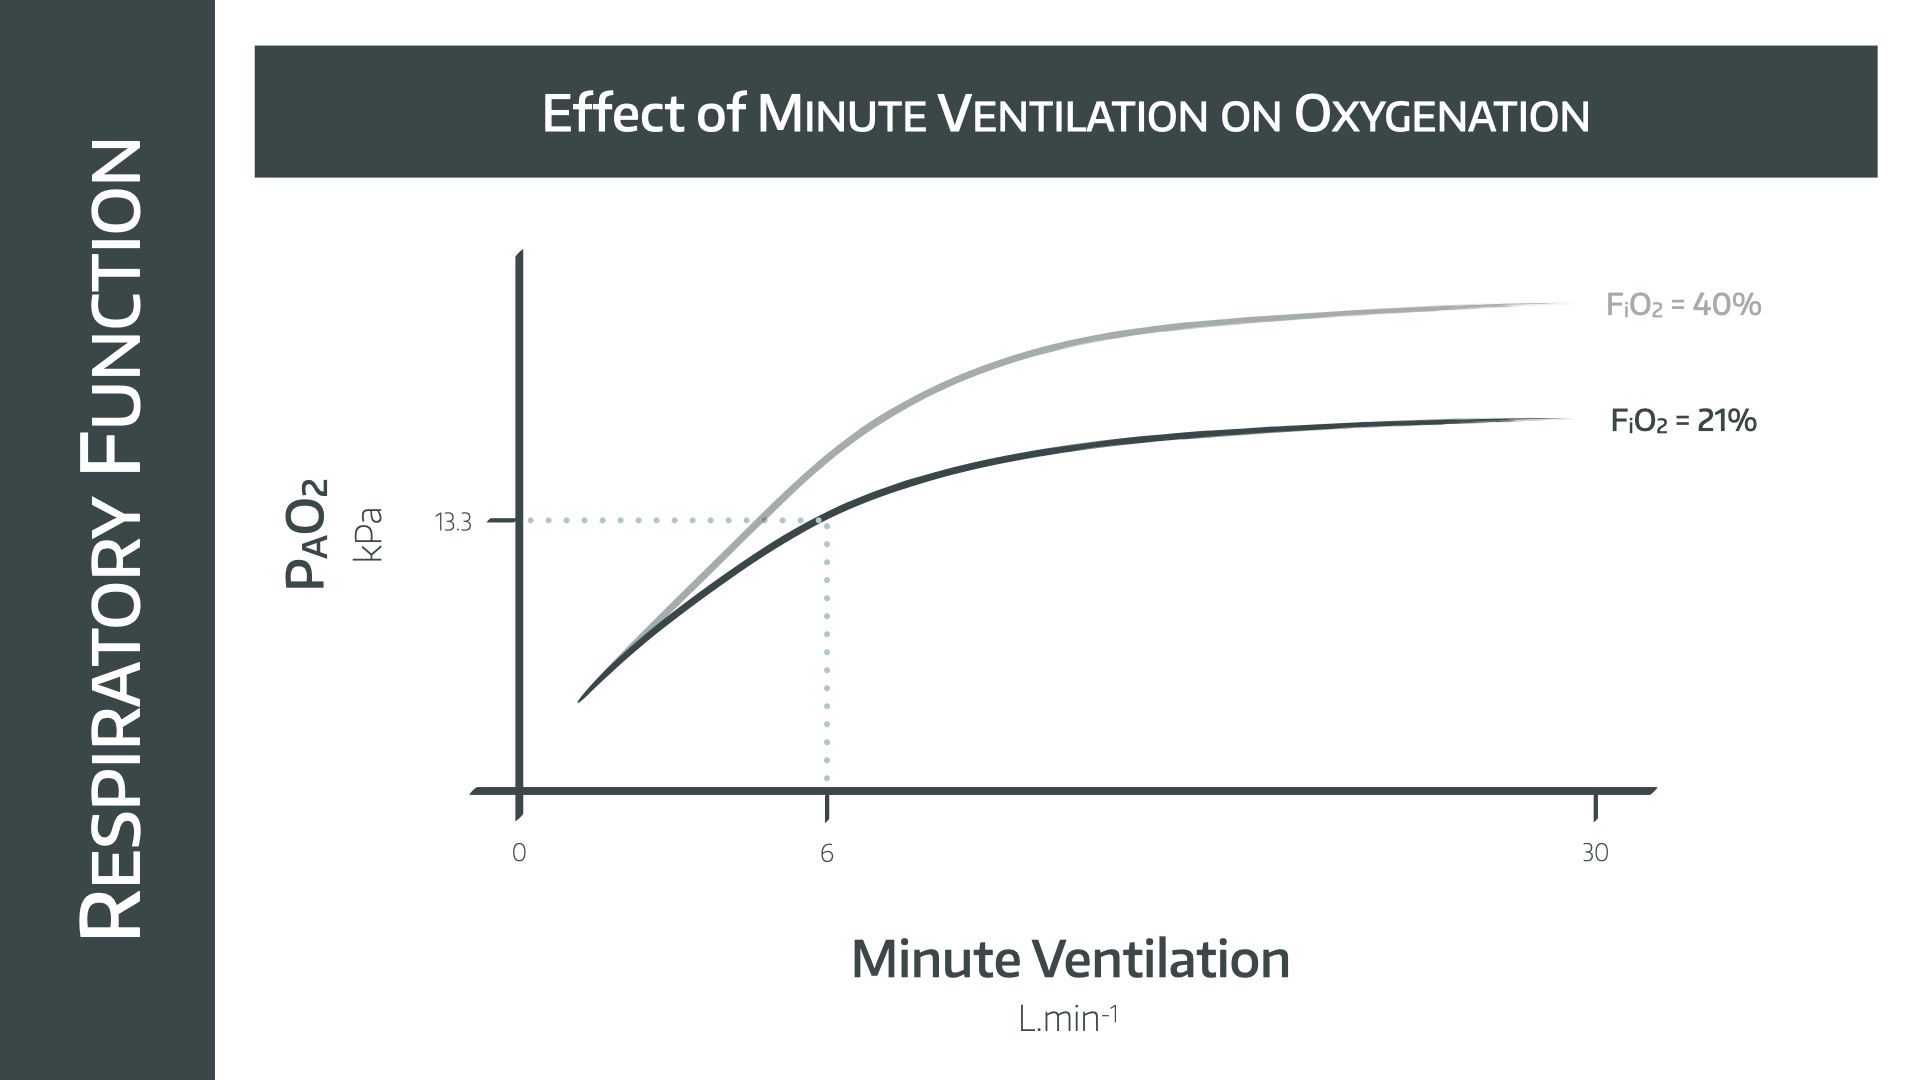
- This is a hyperbolic graph passing through the point of MV = 6l/min and PAO2 = 13.3kPa
The key point of this graph for the exam is that hyperventilation does not dramatically improve PAO2, but only a small amount of hypoventilation can cause rapid desaturation.
- This is sometimes seen prior to extubation of obese patients, if they start to desynchronise with the ventilator and spend a few minutes taking less effective breaths
They might ask you to add in extra lines for different inspired fractions of oxygen on this graph.
- Again, the point is that the only way to effectively increase PAO2 is to increase the FiO2
- If you're feeling really slick, you can demonstrate this with the alveolar gas equation as the FiO2 is a multiplier term
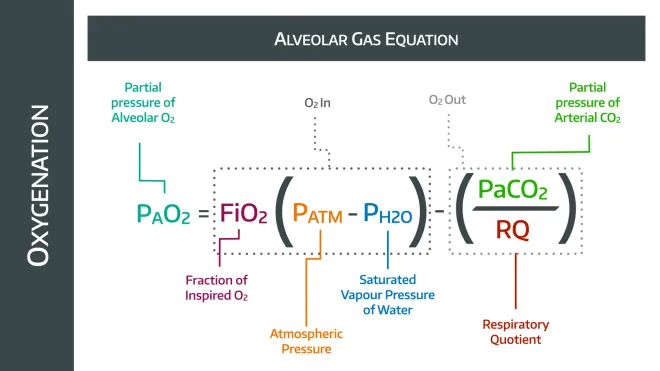
Hyperventilation will reduce the PaCO2, and therefore increase PAO2 in a vaguely linear fashion, while increasing the FiO2 will have a much more profound effect.
What are compliance and resistance?
People get compliance and resistance mixed up a lot, and understandably so - they're not the easiest concepts to get your head around.
- Compliance is how the volume changes for a given change in pressure
- Resistance is the change in pressure for a given change in flow
We'll look at compliance first.
Given we've just said that compliance is a change in volume per change in pressure, it makes sense that the units are usually ml/cmH20 when talking about the lungs.
- It real-world terms, it gives a measure of how ‘stiff’ the lungs and chest wall are
The lungs have a compliance, and the chest wall also has a compliance. Together they sum to give the combined compliance, and you can see them each represented in the graph below.
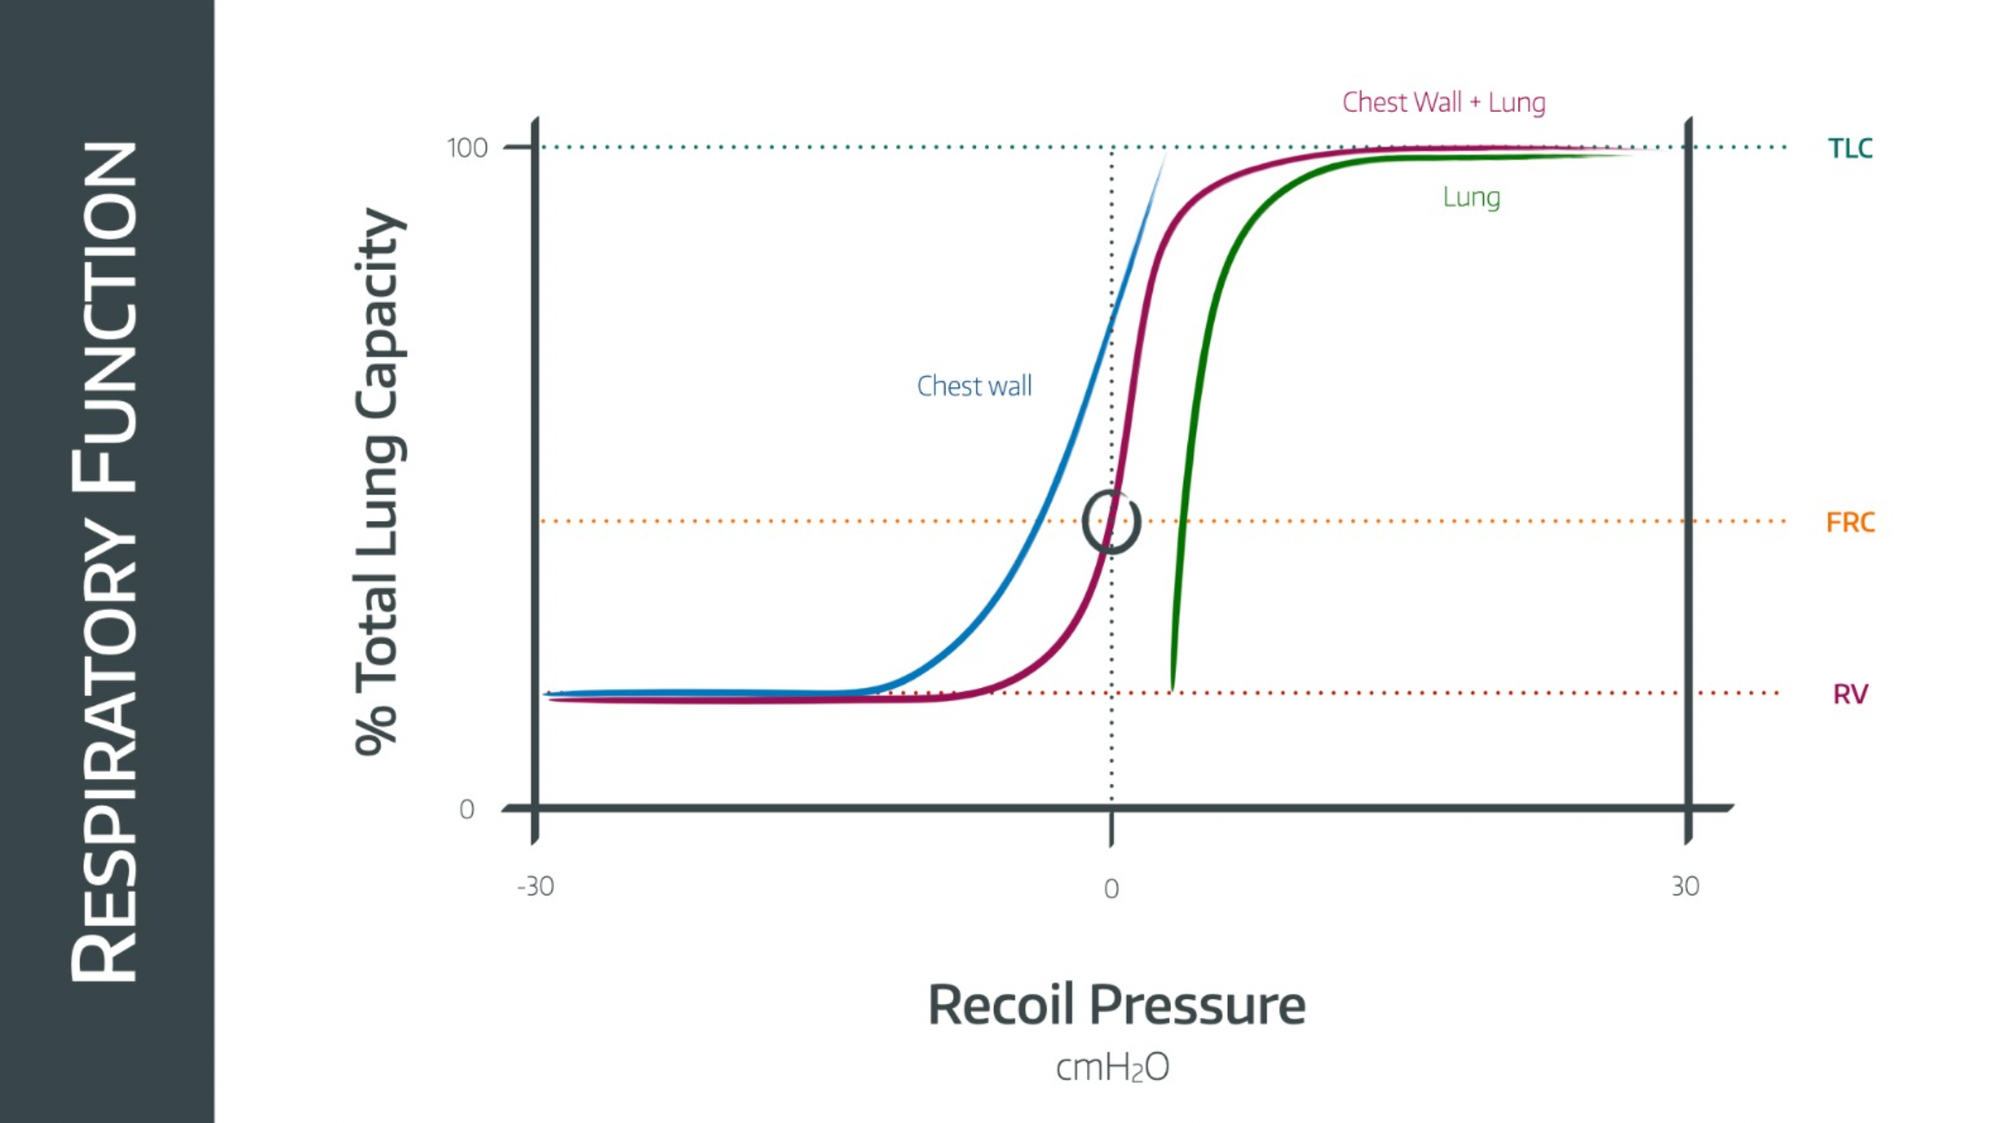
How do you sum the chest wall and lung compliances together?
Remember that you have to sum them a bit like resistances in parallel in an electric circuit, using their reciprocals
- 1/total compliance = 1/lung compliance + 1/chest wall compliance
General example:
- Chest wall compliance is approximately 200ml/cmH20
- Lung compliance is similar, around 150-200ml/cmH20
- Therefore total compliance is around 75-100ml/cmH20
What is the difference between static and dynamic compliance?
- Static compliance is the compliance of the lung, in ml/cmH20, when there is no gas movement in the airways
- This is usually higher because it allows time for the change in volume to ‘catch up’ and equilibrate with the change in pressure, and so you tend to end up with a larger volume change per unit pressure change
If this doesn't make sense, imagine applying 30cmH2O of pressure to a balloon, waiting for it to stop inflating, and then measuring the overall change in volume that has occured.
It makes sense that the volume change, and therefore compliance, is a little higher than if you measured it while it was inflating, because you've allowed a little extra time for the inward air flow to come to a stop, and during that time the balloon will have inflated a little more.
- Dynamic compliance is the compliance when there is gas flow, during the respiratory cycle
What’s resistance?
- In the context of lung physiology, resistance is the change in pressure in cmH2O for a given change in flow of air through the airways
- It therefore has the units cmH2O per litre per second
Can you draw the pressure-volume loop for the lung as a single unit?
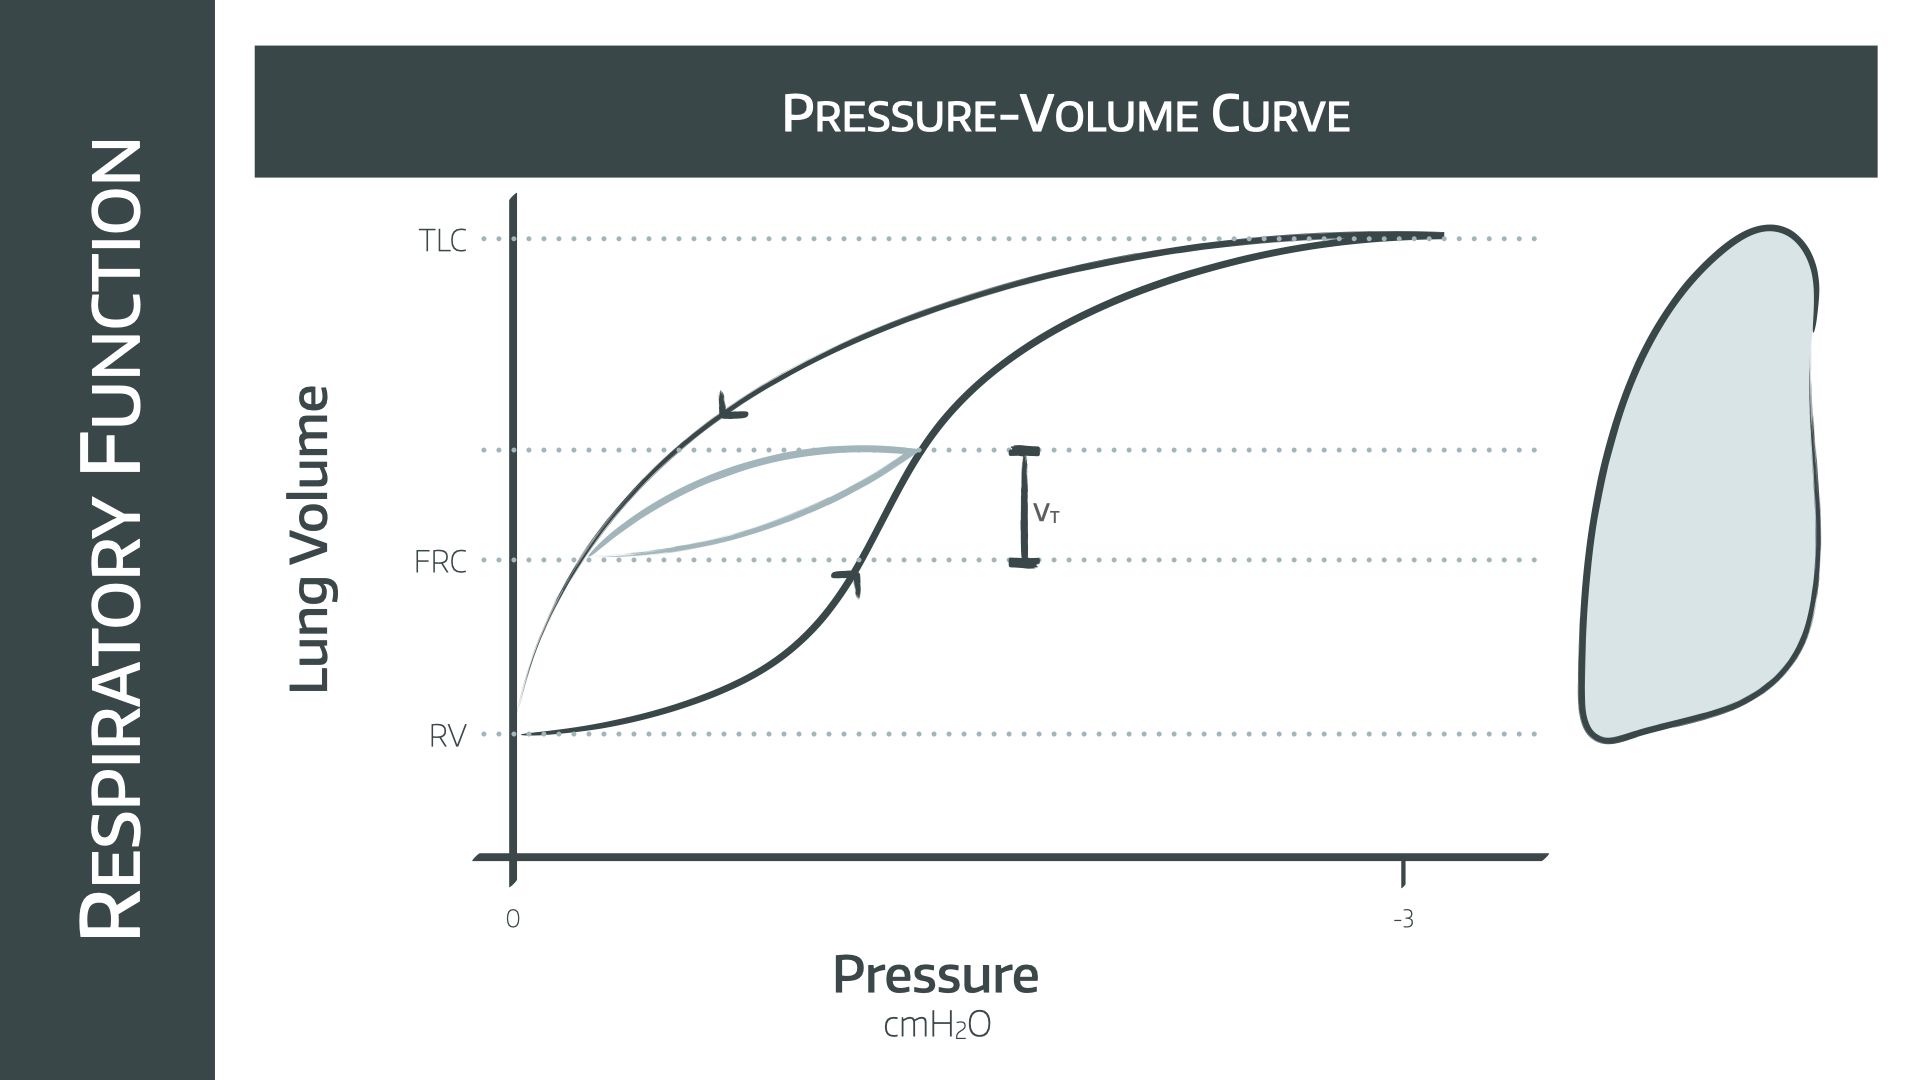
This graph depicts the pressure and volume changes for a full vital capacity breath
Note that the pressures on the x axis are negative so we are looking at spontaneous respiration, not mechanical positive pressure ventilation
- The graph for IPPV is similar but has positive pressures instead
Inspiratory limb
- Starting at full expiration, the inspiratory limb of the graph is a sigmoid shape, demonstrating that while the lung is relatively empty at residual volume, the compliance is lower and more pressure change is needed to generate a change in volume
- At FRC the inspiratory limb is at its steepest, demonstrating the point of maximal compliance
- This then flattens out as the lungs distend and compliance decreases
Expiratory limb
- The shape is different to the inspiratory limb because there is the added effect of the elastic recoil of the lung tissue
- Again, at higher volumes the compliance of the lung remains low, so there is a big pressure change before any significant decrease in volume
- Again the FRC represents the point of maximal compliance, and the steepest part of the curve is found here
Tidal breath
- This is represented by the smaller light blue curve
- This starts at FRC and has a vaguely similar shape but a much smaller change in pressure and volume
Zones and their differences
- Different areas of the lung sit at different points on the curve, with upper lobes starting higher on the curve as they are already more distended than the lower zones due to gravity
- This is why upper areas of the lung are relatively less compliant
- During IPPV, everything shifts down the curve, and so the upper alveoli become more compliant
Useful Tweets
Recognizing problems with airway resistance or lung compliance is especially important in Pressure Control. Does anyone use pressure as their initial mode of ventilation? #MedTwitter #MedEd #ICU pic.twitter.com/Y7I5MUnyC6
— Critical Cultivation (@CritCultivation) February 27, 2022
Work Of Breathing in relation to Lung & Chest wall compliance (Campbell Diagram)
— Society of Mechanical Ventilation (@OfVentilation) May 1, 2023
An Approach to Mechanical Heart-Lung Interaction https://t.co/RqbRs8kRoz pic.twitter.com/JCrF5Rw4tb
Amazing Free SBA and MCQ revision


References and Further Reading


Primary FRCA Toolkit
Everything you need for the exams, all in one place.

Discount is applied as 6 months free membership - please don't hesitate to email Anaestheasier@gmail.com if you have any questions!
Just a quick reminder that all information posted on Anaestheasier.com is for educational purposes only, and it does not constitute medical or clinical advice.